统计图表模板(PPT 109页)
统计图表模板(PPT 109页)内容简介
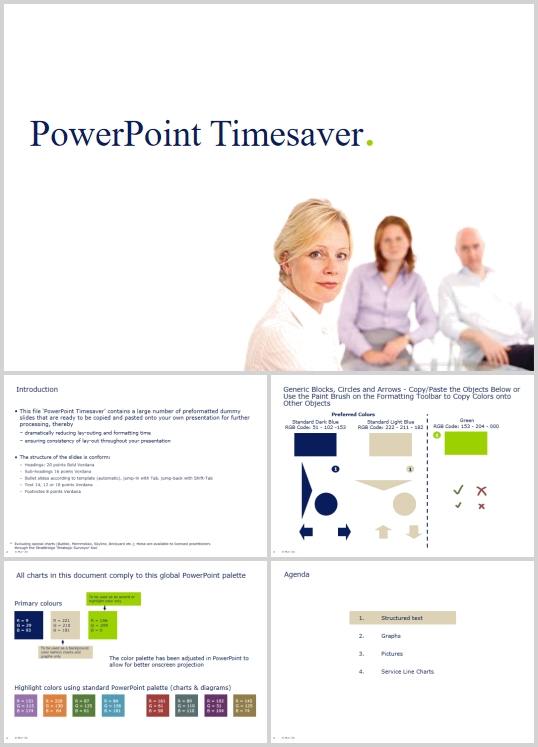
Agenda
TextBlocks-UnrelatedList
TextBlocks-CausesandEffects
TextBlocks-Matrix
TextBlocks-CauseandEffect
TextBlocks-SequenceofCausesandEffects
Text-SequentialVertical
Text-MakingPoints
Text-Bullits
TextBlocks-Influencing
TextBlocks-Leadingto
Text-EnvelopingElements
TextBlocks-ElementsLeadingTo
TextBlocks-ResultingFrom
Text-Interrelations
MultipleBoxes
OrgChart
LogicTree-OneLevelPlusText
LogicTree-TwoLevels
LogicTree-Vertical
DriverTree-ArrowsShowingTrend
DriverTree-ArrowsShowingBaseTrends
DriverTree-MoonsShowingBaseTrends
DriverTree-TextwithGeneralTrends
DriverTree-ExpandedText
Rangeofpossibleoutcomes
StandardTable-bulletedcells
StandardTableLayout
BarChart-Stacked
BarChart-TwoStacked
BarChart-ThreeStacked
BarChart-FourParallel
BarChart-Paired
BarChart-TwoPaired
ColumnChart-Stacked
ColumnChart-TwoStacked
ColumnChart-Paired
ColumnChart-TwoPaired
ColumnChart-Multiple
PieChart
RadarChart
LineChart
LineChart-Two
WaterfallChart
WaveChart
DriverTreeChart/DupontChart
Moons
TrafficLights
Arrows
Donuts
Timeline
ValueChains-LooseArrows
ValueChains-TouchingArrows
InterrelatedStages
Movements
Circle-OverlappingArrows
Circle-IntegratedArrows
ClosedLoop
ProcessEndinginaClosedLoop
WheelofFortune
..............................
下一篇:尚无数据